One of the best features in Sitecore 9 is the concept of xConnect. A unified and more robust set of APIs to interact with xDB. As part of this suite, we have the Automation Engine which is in charge of processing contacts, interactions, etc in campaigns within Marketing Automation in Sitecore.

However, since this is a separate service/process from xConnect, with its own binaries, configs, etc. Debugging the code that we deploy to this engine is not as easy as attaching it to the xConnect App Pool. For instance, let’s say that we want to create a custom interaction for our contacts. This would imply creating a controller that will be invoked from our Automation UI. And the location where this dll will have to be deployed would be:
[SITECORE XCONNECT ROOT]\App_Data\jobs\continuous\AutomationEngine\
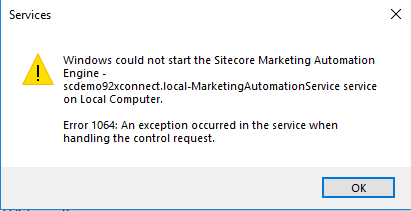
So, in order to debug our code, we need to make sure our Automation Service is running (this is not always the case):
Then, we can head to our solution and attach Visual Studio to the following process:

And that’s it. Now, VS will fall in our breakpoints.
Hope this quick tip was helpful. Happy coding in xConnect!